Thread replies: 156
Thread images: 94
Thread images: 94
File: PISA_Snapshot.gif (173KB, 1160x1910px)

173KB, 1160x1910px
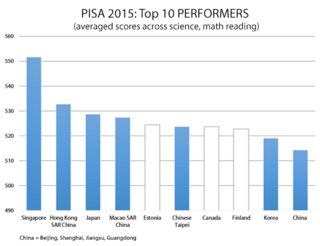
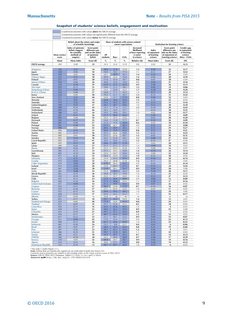
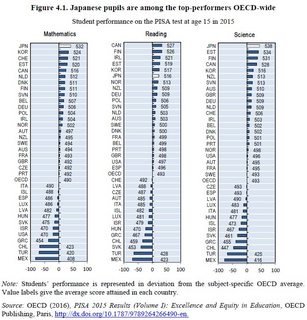
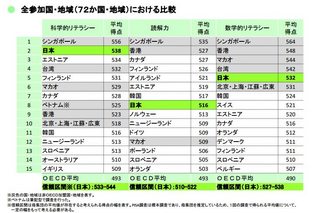
Singapore tops latest OECD PISA global education survey, Japan, Estonia, Finland and Canada are the 4 highest performing OECD countries
www.youtube.com/watch?v=q3TCpzSe4cs
www.youtube.com/watch?v=kgxnle0d_-U
www.youtube.com/watch?v=k8PyHVDmbZo
www.youtube.com/watch?v=9Wbl-PflEc0
www.youtube.com/watch?v=HZjxkDA1s-c
www.youtube.com/watch?v=-xpOn0OzXEw
www.youtube.com/watch?v=YiczDPx96ac
www.youtube.com/watch?v=KdMN8ioUYGc
www.nier.go.jp/kokusai/pisa/video/How_does_PISA_work_640x360.mp4
all4ed.org/debunking-seven-myths-about-pisa/
www.oecd.org/pisa/pisafaq/
www.oecd.org/pisa/data/
52.31.27.158/PISAoccupations/
OECD PISA tests the skills & knowledge of 15 year-olds, providing the global benchmark for the quality, equity & efficiency of school systems.
>>
File: PISA_Immigrant-vs-native-students-performance-in-science.gif (77KB, 875x1355px)

77KB, 875x1355px
>>9105943
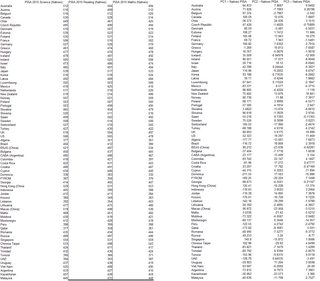
Immigrant students perform better in science than non-immigrants in ARE, AUS, CAN, GBR, HKG, ISR, JOR, MAC, QAT, SGP, & USA
>>
File: PISA_Disadvantaged-students.gif (114KB, 1070x1865px)

114KB, 1070x1865px
>>9105945
Where do disadvantaged students achieve the best results in science?
>>
File: PISA_Top-performers-low-achievers.gif (124KB, 1020x1740px)

124KB, 1020x1740px
>>9105948
What does the share of top performers and low achievers look like in your country?
>>
File: CsY3fOLXgAAMavE.png large.png (173KB, 986x1200px) Image search:
[Google]
173KB, 986x1200px
>>9105943
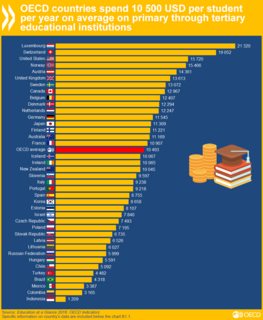
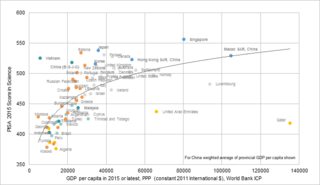
Money is not everything
>>
File: C9x-zUvWAAQOPmD.jpg large.jpg (84KB, 924x453px)

84KB, 924x453px
>>9105943
Are 15-year-olds happy in your country?
>>
>>9105945
bad news for arabs, they can't do better than the Europeans in any case.
good news for the chinese, doing very good in Canada and Australia.
>>
File: C9xCGiRXgAQcEm_.jpg large.jpg (178KB, 835x1215px) Image search:
[Google]
178KB, 835x1215px
>>9105952
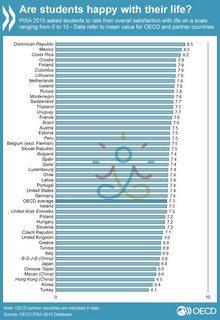
Schools are not just places where students acquire academic skills; they also help students become more resilient in the face of adversity, feel more connected with the people around them, and aim higher in their aspirations for their future.
Not least, schools are the first place where children experience society in all its facets, and those experiences can have a profound influence on students’ attitudes and behaviour in life.
PISA is best known for its data on learning outcomes, but it also studies students’ satisfaction with life, their relationships with peers, teachers and parents, and how they spend their time outside of school.
PISA results show that students differ greatly, both between and within countries, in how satisfied they are with their life, their motivation to achieve, how anxious they feel about their schoolwork, their expectations for the future, and their perceptions of being bullied at school or treated unfairly by their teachers.
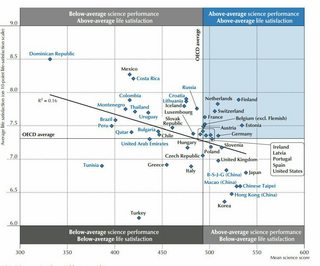
Students in some of the countries that top the PISA league tables in science and mathematics reported comparatively low satisfaction with life; but Finland, the Netherlands and Switzerland seem able to combine good learning outcomes with highly satisfied students.
It is tempting to equate low levels of life satisfaction among students in East Asia or elsewhere to long study hours, but the data show no relationship between the time students spend studying, whether in or outside of school, and their satisfaction with life.
And while educators often argue that anxiety is the natural consequence of testing overload, the frequency of tests is also unrelated to students’ level of schoolwork-related anxiety.
There are other factors that make a difference to student well-being, and much comes down to teachers, parents and schools.
The challenges to students’ well-being are many, and there are no simple solutions. But the findings from PISA show how teachers, schools and parents can make a real difference.
>>
File: C9xNlhyXgAEakJC.jpg large.jpg (180KB, 800x1260px) Image search:
[Google]
180KB, 800x1260px
>>9105957
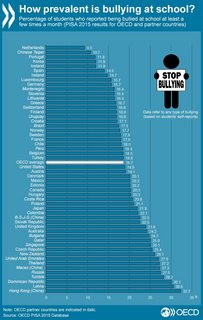
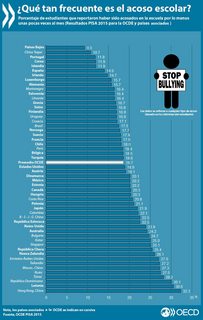
Bullying is a major issue in schools, with a large proportion of students reporting being victims
>>
File: C-LocnnW0AAX9XE.jpg large.jpg (170KB, 800x1260px) Image search:
[Google]
170KB, 800x1260px
>>9105959
>>
>>
File: C9xKq-VXsAAe5UT.jpg (90KB, 971x807px) Image search:
[Google]
90KB, 971x807px
>>
>>9105943
Wouldn't it be nice if there was a freakin spreadsheet somewhere we could download and work with the data on our own?
>>
>>9105984
Data
PISA Education GPS
The Education GPS allows you to download the full set of PISA indicators and generate country profile reports in PDF format.
2015
PISA Data Explorer
The Data Explorer allows you to create your own analyses and build reports from the PISA data sets.
2015 2012
Research Documentation
Assessment and Analytical Frameworks
The theory underlying the PISA surveys – what they aim to achieve and how they are developed – including background questionnaires completed by students, school principals and parents.
2018 2015 2012 2009 2006 2003 2000
Technical Reports
Detailed descriptions of the implementation of the surveys.
2015 2012 2009 2006 2003 2000
Survey Implementation Tools
Field trial materials, translation manuals and technical guidelines used to carry out the surveys.
2018 2015 2012
PISA Database
The PISA database contains the full set of responses from individual students, school principals and parents. These files will be of use to statisticians and professional researchers who would like to undertake their own analysis of the PISA data. The files available on this page include background questionnaires, data files in ASCII format (from 2000 to 2012), codebooks, compendia and SAS™ and SPSS™ data files in order to process the data.
2015 2012 2009 2006 2003 2000
>>
>>9105943
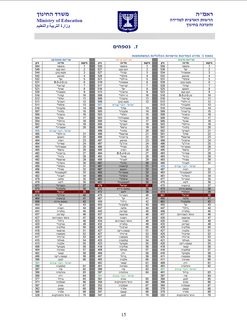
Kek, jews are brainlets
>>
File: Israel_pisa_2015.png (139KB, 1019x1320px) Image search:
[Google]
139KB, 1019x1320px
>>9105991
>jews
>>
>>9105984
OECD site:
http://www.oecd.org/pisa/data/
>>
File: 1434556085547.png (6KB, 419x249px)

6KB, 419x249px
:D :DDD
>>
File: PISA-2015-chart.png (51KB, 420x281px)

51KB, 420x281px
>>
File: PISA-2015-chart-FR.png (46KB, 420x280px) Image search:
[Google]
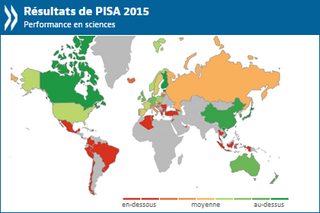
46KB, 420x280px
>>9106156
>>
File: PISA-2015-chart-Spanish (2).png (62KB, 454x302px) Image search:
[Google]
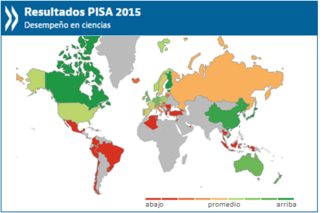
62KB, 454x302px
>>9106158
>>
File: CzBql4EWIAA2KIF.jpg large.jpg (60KB, 918x641px) Image search:
[Google]
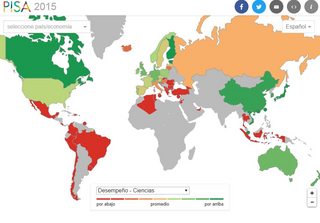
60KB, 918x641px
>>9106159
>>
I enjoy looking at education statistics, but some of these graphs are just bad.
>>9105945
Should have included negative scale.
>>9105948
The idea behind this one is just difficult to understand. The percentages next to country names that are not graphically displayed are somewhat significant in analysing the data.
>>9105949
No definition of top and bottom performers. Useless.
>>9105951
Doesn't even say what it's representing. Instead there's a related fact as the title, that you could clearly see in the graph anyways.
>>9105952
No title, gray bars against white background.
>>9105981
>R^2=0.16
Why even include it, just takes up valuable space.
Also, very few charts showing relations between statistics.
>>
>>9106306
It's just one autists who keeps spamming this shit for some reason. Sage
>>
File: PISA Map legend disclaimer.png (128KB, 663x698px) Image search:
[Google]
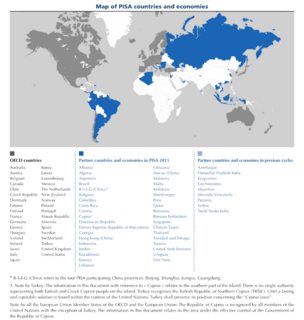
128KB, 663x698px
>>9105943
>>
File: annex---pisa-2015.png (89KB, 792x2256px) Image search:
[Google]
89KB, 792x2256px
>>
File: CzD56WvWIAEkl1I.jpg large.jpg (62KB, 1014x406px) Image search:
[Google]
62KB, 1014x406px
>>
File: blog-eap-pisa-top-10.png (17KB, 600x461px) Image search:
[Google]
17KB, 600x461px
>>
File: edu_graph.png (39KB, 666x384px) Image search:
[Google]
39KB, 666x384px
>>9106360
>>
File: PISA-2015-Reading-Custom.png (1MB, 1527x1045px) Image search:
[Google]
1MB, 1527x1045px
>>
File: PISA-2015-Mathematics-Custom.png (1MB, 1527x1045px) Image search:
[Google]
1MB, 1527x1045px
>>9106366
>>
File: PISA-2015-Science-Custom.png (1MB, 1527x1045px) Image search:
[Google]

1MB, 1527x1045px
>>9106372
>>
File: pisa-science-2.png (275KB, 1841x1642px) Image search:
[Google]
275KB, 1841x1642px
>>9105943
>>
>estonian intellectuals
>>
File: East-Asian-admixture (1).gif (73KB, 800x545px)

73KB, 800x545px
>>9105943
So basically the Chinks & Fingols (Finns & Estonian) own the top 3.
Since Finland DNA is White + Mongol rape baby DNA.
>>
>>9106966
>15-year-olds
>intellectuals
>>
File: 36660600_403.png (320KB, 940x529px) Image search:
[Google]
320KB, 940x529px
>>
File: 36660780_403.png (324KB, 940x529px) Image search:
[Google]
324KB, 940x529px
>>9107677
>>
PISA means nothing because the way it is assessed in the various countries is very different.
In the west they just hand out a booklet to students and tell them to work on it and the kids are like, "ok whatever and they do it half jokingly".
In China and other, "MUST SAVE FACE" cultures, the doctor the results by picking the best schools and making sure the kids get the highest possible scores.
>>
File: 36660816_403.png (320KB, 940x529px)

320KB, 940x529px
>>9107678
>>
>>9106974
Finland has super inclusive education. There's basically no shit schools over there. They aren't geniuses but they are raising the average by making sure that there are no long tail on the bottom end of the bell curve.
It's basically the opposite of what the US does.
Chinks are doctoring the results, like they always do.
>>
File: PISA 2012 Response rate.png (35KB, 769x580px) Image search:
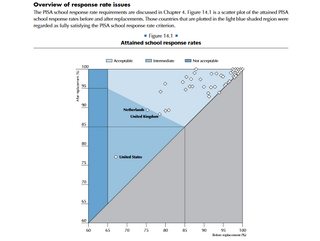
[Google]
35KB, 769x580px
>>9107681
>picking the best schools
Actually a closer look to the results tells us that the ones actually cheating are not the Chinese
>>
>>9105943
Why do you keep posting this? It's like once a month.
>>
>>9107681
>In the west they just hand out a booklet to students and tell them to work on it and the kids are like, "ok whatever and they do it half jokingly".
>In China and other, "MUST SAVE FACE" cultures, the doctor the results by picking the best schools and making sure the kids get the highest possible scores.
Another typical excuse by white people, this is why the West is declining, even though lack of motivation has been pointed out as one of the reasons for the comparatively low results in some Western countries, those claims are actually anecdotical or just accusations made in newspapers or image-based bulletin boards and not supported by scientific evidence.
>>
File: 36660672_403.png (324KB, 940x529px) Image search:
[Google]
324KB, 940x529px
>>9107685
>>
File: 36660744_403.png (326KB, 940x529px) Image search:
[Google]
326KB, 940x529px
>>9108332
>>
File: solhverv.jpg (166KB, 800x577px) Image search:
[Google]

166KB, 800x577px
>>9105945
>Foreign students do better in Asian, Jewish, Arab, and multicultural countries
>Domestic students do better in Europe
I think we all know who has the phenotype, and (((who))) is trying to subvert its significance.
>>
>>9107681
Eh...mediocre arguments at best. In Canada, East Asians and Indians comprise about 85+% of accelerated high school programs, not to mention being the largest demographic pursuing post-secondary degrees. Not taking PISA seriously means the teachers are failing, since it was meant to be an index of performance.
But if you were commenting simply because you are insecure about your race's IQ, that's fine.
>>
Being below Finland is a BIG deal here in Norway for some reason. Being just above average is a big deal. I think we should be happy. Elementary school knowledge doesn't matter anyways.
>>
>>9105993
What does it mean?
>>
>>9105945
What a fucking surprise, if you are not really clever, you won't waste time and money for a foreign uni, because it wont be really useful or you.
t. international student
>>
>>
>>9106380
So basically, part of the reason why Singapore, Finland, Japan and Estonia (for example) score so highly is that everyone else is consistently underrepresented in samples. These comparisons are invalid if the samples are not always representative.
>>
>>9107765
Your graph suggests nothing of the sort and is not a rebuttal of the point raised.
>>
>>9108609
Basically PISA only gives us information about the "PISA Target Population" which is defined as
>"all students between 15 years and 3 [completed] months and 16 years and 2 [completed] months at the beginning of the testing period, attending educational institutions located within the adjudicated entity, and in grade 7 or higher"
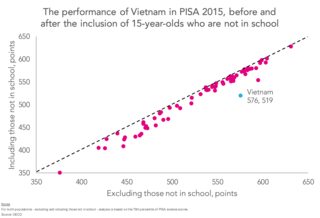
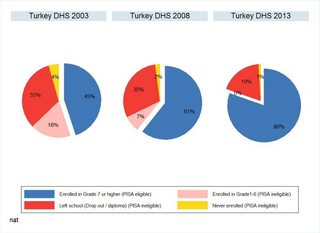
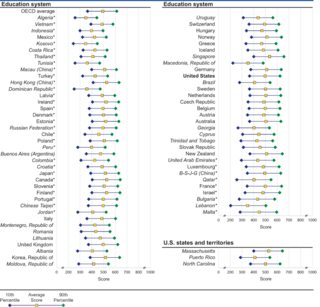
and those details may seem mundane technicalities because in pretty much all of the OECD countries all 15-year-olds are actually enrolled in school and in grade seven or higher, but in some countries it can make a big difference, including OECD countries like Mexico and Turkey, PISA tells us nothing about 15-year-olds that have already left the education system completely or are enrolled in primary school, again, that doesn't really matters in most of the developed world because pretty much all 15-year-olds are enrolled in secondary school, and therefore PISA results can be extended, with some caution but with a high degree of confidence, beyond the PISA target population to all 15-year-olds in those adjudicated entities, but in some countries the share of out-of-school 15-year-olds and the share of 15-year-olds who are still enrolled in primary school is very significant of the overall 15-year olds population, this is extremely important when interpreting PISA results because the coverage of the "PISA target population" rages from 49% in Vietnam to more than 95% in Finland, Germany, Ireland, Malta, the Netherlands, Russia, Singapore, Switzerland and CABA, again this is very important becase, we do know from independent studies that teenagers that leave the school early or enrolled in primary school are academically weaker than their counterparts in secondary school.
>>
>>9109513
take again for example Vietnam, only 48.5% of 15-year-olds in Vietnam actually qualify to make it into PISA (the other 51.5% have left the education system or are still enrolled in primary school) if PISA was a study about all 15-year-olds, Vietnam would perform way weaker than what it actually does now, another example, even though Montenegro and Mexico perform very similar in reading, mathematics and science performance, in Montenegro 90% of their 15-year-olds are enrolled in secondary in school but in Mexico the figure is 62% if we were to add the other 10% of Montenegrines not enrolled in school Montenegro would perform lower but including the 38% of Mexicans not in school would make Mexico drop even higher, countries like Singapore (96% enrolled in secondary school), Japan (95% enrolled in secondary school) and Finland (97% enrolled in secondary school) perform above the rest of the countries and they do so with pretty much all 15-year-olds in school, somewhat different from Canada (84%), Hong Kong (89%) or Macau (88%)
>>
Smart jews is a meme, kek.
>>
>>9108332
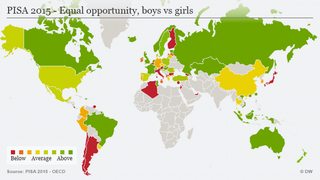
What does it mean? Girls in Finland don't get education?
>>
>>9105993
t.brainlet
>>
>>9109546
>>9109546
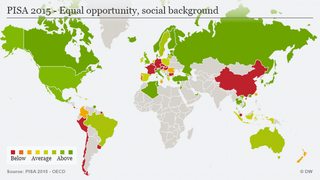
Again this is really important not only when interpreting average PISA performance but also other dimensions like social inequality or progress, for example Mexico is one of the countries in which the students' social background doesn't have much of an impact upon performance but that is mostly because a lot of the 15-year-olds in the lowest socio-economic stratas doesn't make it into the PISA sampling frame, if PISA was a study was a study of 14-year-olds rather than 15-year-olds, Mexico would have a higher social inequality, and the same goes for a lot of countries, if it was a study of 17-year-olds rather than 15-year-olds, countries like the United Kingdom and Sweden would perform better and social inequality would be less because a lot of their lowest-achieving students leave the education system at age 16
>>
File: 1308550589001.jpg (248KB, 1280x734px) Image search:
[Google]

248KB, 1280x734px
>>9105943
8th Vietnam.
So is Vietnam honorary White now?
>>
File: 1500434194382.jpg (32KB, 400x382px) Image search:
[Google]

32KB, 400x382px
>>9109554
American Jews are smarter than Israeli Jews.
Also a lot of Arabic Palestinians live in Israel too, pushing down the average just like blacks in USA.
>>
File: The educational status and PISA eligibility of 15-16 year-olds in Turkey in 2003, 2008 and 2013.jpg (38KB, 806x587px) Image search:
[Google]
38KB, 806x587px
>>9109600
Some countries like Turkey, Peru and Albania have made great improvements in their average scores over the years while also decreasing the achievement gap, but those outcomes have been underestimated both progress in learning outcomes and in inequity because those claims do not take into account the large proportion of 15-16 year-olds that are ineligible for the PISA sampling frame, if one takes into account the changing proportions of PISA-eligible 15-16-year-olds in those countries is gigantic, for example Peru had an average reading score of 327 in 2001 but at that time only 50% of Peruvians were PISA-eligible, by 2015 their reading score went up to 327 but now 74% of Peruvians were PISA-eligible, in 2001 only 40% of 15-year-olds Albanians were covered by the PISA sampling frame, in 2015 it was 84%, in Turkey it was 36% in 2000 and 70% in 2015, all of this tell us that when PISA-ineligible 15-16 year-olds are accounted for, the improvements over time are larger than traditionally reported.
>>
File: when the ? kicks in.gif (458KB, 256x256px) Image search:
[Google]

458KB, 256x256px
>>9109612
>USA: 58,000 dead
>North Vietnam: 1 million dead
>Damage to US soil: Literally none
>Damage to Vietnam soil: Disease, landmines, poisoned water and land, burned villages, ruined farm line, all infrastructure destroyed
America didn't win but it wasn't exactly a fun laugh a minute time for Vietnam.
>>
>>9109569
Girls is Finland, Jordan, U.A.E., Albania and Macedonia do way better than boys, girls in Austria, Costa Rica, Italy, Chile and Japan do way worse than boys
>>
File: finland-pisa1.png (10KB, 809x403px) Image search:
[Google]
10KB, 809x403px
>>9106016
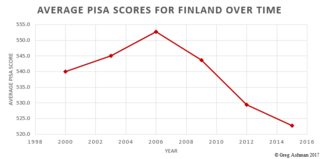
Ebin
>>
File: ae983dd69a1157ab7f7342a6037b38f10d652402_full.jpg (33KB, 600x600px) Image search:
[Google]

33KB, 600x600px
>>9109662
>>9105943
WELL FUGG :DDD
EBIN :DDD
Finland rank still high tho.
>>
>>9108613
Actually the chart suggests that they are not "doctoring the results" they do not pick the best schools, I mean, schools are not even chosen by the countries but by an international contractor (which in 2015 was Westat and to a lesser extend the Australian Council for Educational Research by the way), of course you'd know this if you had read at least one of the PISA technical reports or at least see the OP's videos
>>
Are the Chinese cheating in PISA or are we cheating ourselves?
2017-08-17 02:02:26
Post No.9109914
[Report] Image search: [Google]
[Report] Image search: [Google]
Are the Chinese cheating in PISA or are we cheating ourselves?
2017-08-17 02:02:26
Post No.9109914
[Report]
File: shutterstock_11389939_shanghai.jpg (21KB, 500x375px) Image search:
[Google]

21KB, 500x375px
>>9109910
>>9107681
Whenever an American or European wins an Olympic gold medal, we cheer them as heroes. When a Chinese does, the first reflex seems to be that they must have been doping; or if that’s taking it too far, that it must have been the result of inhumane training.
There seem to be parallels to this in education. Only hours after results from the latest PISA assessment showed Shanghai’s school system leading the field, Time magazine concluded the Chinese must have been cheating. They didn't bother to read the PISA 2012 Technical Background Annex, which shows there was no cheating, whatsoever, involved. Nor did they speak with the experts who had drawn the samples or with the international auditors who had carefully reviewed and validated the sample for Shanghai and those of other countries.
covered by Shanghai’s PISA sample, because years ago those migrants wouldn't have had access to Shanghai’s schools. But, like many things in China, that has long changed and, as described by PISA, resident migrants were covered by the PISA samples in exactly the way they are covered in other countries and education systems. Still, it seems to be easier to cling to old stereotypes than keep up with changes on the ground (or to read the PISA report).
>>
>>9109914
True, like other emerging economies, Shanghai is still building its education system and not every 15-year-old makes it yet to high school. As a result of this and other factors, the PISA 2012 sample covers only 79% of the 15-year-olds in Shanghai. But that is far from unique. Even the United States, the country with the longest track record of universal high-school education, covered less than 90% of its 15-year-olds in PISA - and it didn't include Puerto Rico in its PISA sample, a territory that is unlikely to have pulled up U.S. average performance.
International comparisons are never easy and they are never perfect. But anyone who takes a serious look at the facts and figures will concede that the samples used for PISA result in robust and internationally comparable data. They have been carefully designed and validated to be fit for purpose in collaboration with the world’s leading experts, and the tests are administered under strict and internationally comparable conditions. Anyone who really wants to find out can review the underlying data.
Short of arguments about methodology, some people turn to dismissing Shanghai’s strong performance by saying that Shanghai’s students are only good on the kind of tasks that are easy to teach and easy to test, and that those things are losing in relevance because they are also the kind of things that are easy to digitise, automate and outsource. But while the latter is true, the former is not. Consider this: Only 2% of American 15-year-olds and 3% of European ones reach the highest level of math performance in PISA, demonstrating that they can conceptualise, generalise and use math based on their investigations and apply their knowledge in novel contexts. In Shanghai it is over 30%. Educators in Shanghai have simply understood that the world economy will pay an ever-rising premium on excellence and no longer value people for what they know, but for what they can do with what they know.
>>
>>9109916
PISA didn't just test what 15-year-olds know in mathematics, it also asked them what they believe makes them succeed. In many countries, students were quick to blame everyone but themselves: More than three-quarters of the students in France, an average performer on the PISA test, said the course material was simply too hard, two-thirds said the teacher did not get students interested in the material, and half said their teacher did not explain the concepts well or they were just unlucky. The results are very different for Shanghai. Students there believe they will succeed if they try hard and they trust their teachers to help them succeed. That tells us a lot about school education. And guess which of these two countries keeps improving and which is not? The fact that students in some countries consistently believe that achievement is mainly a product of hard work, rather than inherited intelligence, suggests that education and its social context can make a difference in instilling the values that foster success in education.
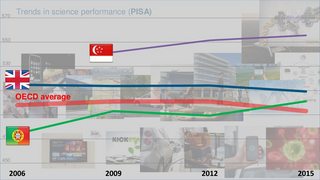
And even those who claim that the relative standing of countries in PISA mainly reflects social and cultural factors must concede that educational improvement is possible: In mathematics, countries like Brazil, Turkey, Mexico or Tunisia rose from the bottom; Italy, Portugal and the Russian Federation have advanced to the average of the industrialised world or close to it; Germany and Poland rose from average to good, and Shanghai and Singapore have moved from good to great. Indeed, of the 65 participating countries, 45 saw improvement in at least one subject area. These countries didn't change their culture, or the composition of their population, nor did they fire their teachers. They changed their education policies and practices. Learning from these countries should be our focus. We will be cheating ourselves and the children in our schools if we miss that chance..
>>
>>9109918
International comparisons are never easy and they aren’t perfect. But PISA shows what is possible in education, it takes away excuses from those who are complacent, and it helps countries see themselves in the mirror of the educational results and educational opportunities delivered by the world’s leaders in education. The world has become indifferent to tradition and past reputations, unforgiving of frailty and ignorant of custom or practice. Success will go to those individuals, institutions and countries which are swift to adapt, slow to complain and open to change. And the task for governments is to help citizens rise to this challenge. PISA can help to make that happen
>>
>>9109649
Actually makes swnse
>>
>>9107765
American during testing shit usually ramp up expulsions or other ways to prevent low performing people from taking it
>>
>>9109939
I think issomething more like this
https://www.youtube.com/watch?v=ImmV3gH8iVk
more or less the same situation as in other anglo countries and the Netherlands, and actually in 2000, 2003 and 2015 the school response rates were so low in the Netherlands, the United Kingdom and Malaysia, respectively, that their results were not fully comparable and therefore not included in the PISA databses and in most figures
>>
>>9109916
>>9109914
Why are you morons comparing cities with countries? Why are you not comparing Shangai with Boston? China's PISA takers are all from big cities. In western countries and Japan, the samples are more representative of the general population in education at 15.
And the part about being validated by an international committee is bullshit. The referee does whatever the Chinese command. It's their turf, and they make the rules.
This is all too typical.
The cheating is transparent as fuck. Not that chink apologists would admit it.
>>
>>9109918
>The fact that students in some countries consistently believe that achievement is mainly a product of hard work, rather than inherited intelligence, suggests that education and its social context can make a difference in instilling the values that foster success in education.
It suggests nothing of the sort. Education is useless everywhere, including high-performing countries (even China). Intelligence and personality is heritable. This should be commonly accepted on /sci/, since it is a settled scientific fact, but since this place is full of brainlets and shills...
>>
>>9109955
Your video suggests the opposite of "cheating" on the PISA. The phenomenon described in all likely-hood significantly retards PISA results in the US.
>>
>>9110125
>The cheating is transparent as fuck
And why don't you back up your opinions with some evidence? I have never encountered even a preliminary informal proposal about Chinese cheating on PISA.
>>
>>9110194
>>9110125
And by the way, there have been times in which the OECD has removed data because of technical anomalies or because the data did not meet the OECD technical standards for PISA.
For example in PISA 2015, even though Argentina (except for CABA), Malaysia and Kazakhstan participated, their results are not fully comparable to those of other countries or to results for them from previous years.
Argentina (except fot CABA) had issues with sample coverage (there was a re-structuring of Argentina's secondary schools which is likely to have affected the coverage of eligible schools listed in the sampling frame, http://www.mdzol.com/nota/707847-la-ocde-asegura-que-no-excluyo-a-argentina-por-una-cuestion-politica/)
Malaysia had issues with school response rates (51% of weighted response rate among the initially sampled Malaysian schools and 98% (wtf) after replacements, see >>9107765 and http://ongkianming.com/2016/12/08/press-statement-did-the-ministry-of-education-try-to-rig-the-pisa-2015-sample-schools-in-order-to-artificially-boost-malaysias-scores/)
and Kazakhstan with construct coverage (national coders lenient in marking on human-coded items AND not following PISA Technical Standards)
In PISA 2000 results for Austria, the Netherlands, Luxembourg and the United Kingdom were not reported even though they participated, in PISA 2003 it was the same for the United Kingdom (again), in PISA 2006 the United States (only reading scores) and in PISA 2009 for Austria (again)
Incidentally, notice how there is not even an East Asian contry on those lists.
>>
>>9105943
niggers got BTFO by asians LMAO
>>
File: IMG_20170817_143354.png (1MB, 606x809px) Image search:
[Google]

1MB, 606x809px
Everyone here is either a Sino shill or a naive Westerner to think we Chinese don't cheat.
>>
File: PISA-2015-by-Steve-Sailer.png (146KB, 446x1406px) Image search:
[Google]
146KB, 446x1406px
>>9110213
>>
File: figure_t6 reading.gif (12KB, 695x437px) Image search:
[Google]
12KB, 695x437px
>>9110297
>>
File: figure_t5 mathematics.gif (12KB, 696x400px) Image search:
[Google]
12KB, 696x400px
>>9110300
>>
File: figure_t7 science.gif (11KB, 693x516px) Image search:
[Google]
11KB, 693x516px
>>9110301
>>
File: internet-aravments-won-all-i-need-to-do-is-call-2425682.png (71KB, 500x477px) Image search:
[Google]

71KB, 500x477px
>>9110215
>>
>>9110215
>2017
>>
File: 95IUqMl.png (106KB, 1418x1246px) Image search:
[Google]
106KB, 1418x1246px
>>9105945
>>
File: CHuluNu.png (55KB, 769x1246px) Image search:
[Google]
55KB, 769x1246px
>>9111279
>>9105945
>>
File: 5fd2b6eaace94260805cae0c5d2a87f6_th.jpg (37KB, 600x423px) Image search:
[Google]
37KB, 600x423px
>>
>>9105957
>Schools are not just places where students acquire academic skills; they also help students become more resilient in the face of adversity, feel more connected with the people around them, and aim higher in their aspirations for their future.
HA HA HA HA HA. HA HA HA HA.
Schools are where physical pavlovian training begins. Rise, shit, brush teeth, take public bus, eat shitty breakfast, be crammed in a room with 40 other idiots, be expected to behave, etc.
This is in regards to the US system. Complete fucking bullshit compared to private schools. I couldn't imagine a more inefficient system of pedagogy than the US K-12 system.
Put kids in bullshit environments.
Force them to fight against their own circadian rhythm, especially teenagers
Get kids used to "3 meals a day" which is horrible because most kids don't even fast. Which means a number of cellular repair protocols aren't even activated.
Have subjects taught by mostly retards.
Strict zero tolerance policies which defy the ideas of justice and reason.
It's a fucking horrible system here. It's 12 years of fucking babysitting and wasting your fucking time on immense amounts of bullshit. When I see the pathologies of society here in the USA, I see behaviors learned in public schools.
t. kid who grew up in Los Angeles.
>>
>>9112221
CONT.
And the worst part? For wasting the most learning sensitive period in your life, they expect to be thanked and honored. Especially the administrators who are the biggest pieces of shit in the universe.
>>
>>9110382
Not him but the Chinese and Indians are notorious for cheating and forging various certificates and diplomas.
Is Software Company #924 going to do its due diligence and travel to India? FUCK NO.
>>
>>9112221
>>9112222
i forgot to add how shitty the food is. Bacon and eggs 1x a day would be far healthier than the shit menu the lunch ladies follow.
"Wow, a chicken patty sandwich. I'm sure glad that it's between two buns that block the ability of leptin to signal 'I'm okay and full'"
In a more perfect world, there would be a million tortures for the architects and soldiers of public education in the USA.
>>
>>9112224
Yes, but again, do you at least some kind of evidence that shows that "the Chinese and Indians" cheated on PISA? I have never encountered even a preliminary informal proposal about them cheating on, as stated above there have been times in which, for technical reasons, some countries' data were removed from the databses because their data didn't reflect an accurate reflection of their ability and performance, in 2015 survey operations were carried by Westat and sampling and weighting operations by ACER and Westat, ETS with some sub-contractors had an overall management and oversight of the project etc.
>>
>>9105943
Only 7 Muslim countries but >1/6 of earth's population are muslims.
>>
File: New UNZ.png (247KB, 671x3044px) Image search:
[Google]
247KB, 671x3044px
>In China the doctor the results
>Chinks are doctoring the results, like they always do.
>is not a rebuttal of the point raised
>Everyone here is either a Sino shill or a naive Westerner to think we Chinese don't cheat.
>the Chinese and Indians are notorious for cheating and forging various certificates and diplomas.
Success breeds jealousy
>>
File: PISA-2015-United-States-MA-08.jpg (399KB, 1654x2339px) Image search:
[Google]
399KB, 1654x2339px
>>9105943
>>
File: PISA-2015-United-States-MA-09.jpg (411KB, 1654x2339px) Image search:
[Google]
411KB, 1654x2339px
>>9114275
>>
File: PISA-2015-United-States-MA-10.jpg (275KB, 1654x2339px) Image search:
[Google]
275KB, 1654x2339px
>>9114276
>>
File: PISA-2015-United-States-MA-11.jpg (365KB, 1654x2339px) Image search:
[Google]
365KB, 1654x2339px
>>9114277
>>
File: PISA-2015-United-States-MA-12.jpg (274KB, 1654x2339px) Image search:
[Google]
274KB, 1654x2339px
>>9114279
>>
File: PISA-2015-United-States-MA-13.jpg (361KB, 1654x2339px) Image search:
[Google]
361KB, 1654x2339px
>>9114282
>>
File: PISA-2015-United-States-MA-14.jpg (272KB, 1654x2339px) Image search:
[Google]
272KB, 1654x2339px
>>9114284
>>
File: PISA-2015-United-States-MA-15.jpg (367KB, 1654x2339px)

367KB, 1654x2339px
>>9114285
>>
File: PISA-2015-United-States-MA-16.jpg (412KB, 1654x2339px) Image search:
[Google]
412KB, 1654x2339px
>>9114288
>>
I don't know why Australia ranks that high. We are an extremely stupid people honestly
>>
>>9105955
>bad news for arabs, they can't do better than the Europeans in any case.
But that's wrong
>>
>>9105945
Qatar is more than 40% immigrants.
UAE is more than 80% immigrants.
>>
File: turkey well done.jpg (77KB, 600x900px) Image search:
[Google]

77KB, 600x900px
>>9105981
>be turkey
>>
File: pisa-excellence-and-equity-42-1024.jpg (115KB, 1024x576px) Image search:
[Google]
115KB, 1024x576px
>>9114359
>>9114350
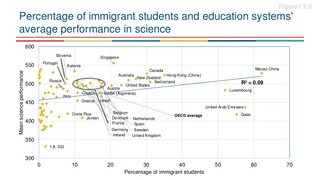
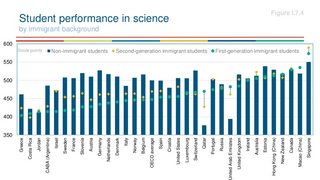
There's no correlation between foreign-born students and performance in PISA
>>
File: pisa-excellence-and-equity-41-1024.jpg (126KB, 1024x576px) Image search:
[Google]
126KB, 1024x576px
>>9115152
>>
File: pisa-excellence-and-equity-43-1024.jpg (101KB, 1024x576px) Image search:
[Google]
101KB, 1024x576px
>>9115153
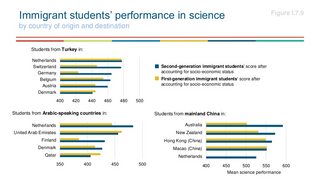
The country you go to matters more than the country you came from
>>
File: pisa-excellence-and-equity-63-1024.jpg (51KB, 1024x576px) Image search:
[Google]
51KB, 1024x576px
>>9112221
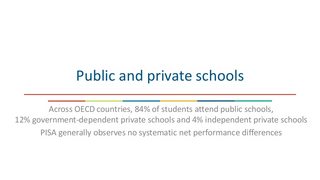
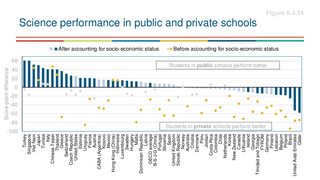
>compared to private schools
>>
File: pisa-excellence-and-equity-64-1024.jpg (138KB, 1024x576px) Image search:
[Google]
138KB, 1024x576px
>>9115941
>>
File: DAmYJG2XkAQRaV5.jpg large.jpg (128KB, 724x755px) Image search:
[Google]
128KB, 724x755px
>>
File: C9wFNmQXoAAhf9F.jpg large.jpg (86KB, 734x489px) Image search:
[Google]
86KB, 734x489px
>>9116274
>>
File: 3940c.gif (9KB, 515x395px)

9KB, 515x395px
>>9116283
>>
File: portugal-2017-oecd-economic-survey-boosting-growth-and-wellbeing-24-1024.jpg (91KB, 1024x768px) Image search:
[Google]

91KB, 1024x768px
Bravo Portugal!
>>
File: effective-policy-for-teaching-testing-talent-and-technology-3-1024.jpg (129KB, 1024x576px) Image search:
[Google]
129KB, 1024x576px
>>9117182
>>
>>9106360
>white countries have white bars
What shitlord came up with this?
>>
File: figure_r1a.gif (59KB, 778x747px) Image search:
[Google]
59KB, 778x747px
>>9105943
>>
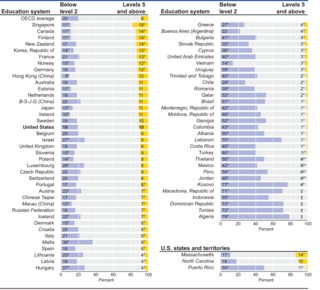
File: figure_r2a.gif (60KB, 778x705px) Image search:
[Google]
60KB, 778x705px
>>9117620
>>
File: figure_r3a.gif (41KB, 778x1114px) Image search:
[Google]

41KB, 778x1114px
>>9117623
>>
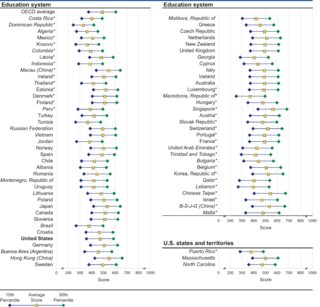
File: figure_m1a.gif (59KB, 778x747px) Image search:
[Google]
59KB, 778x747px
>>9117626
>>
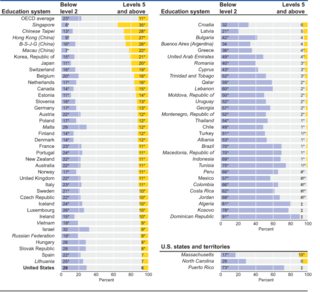
File: figure_m2a.gif (60KB, 778x709px) Image search:
[Google]
60KB, 778x709px
>>9117629
>>
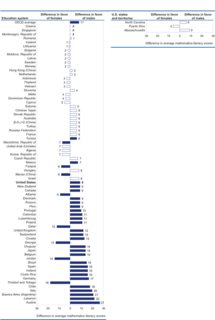
File: figure_m3a.gif (40KB, 778x1156px) Image search:
[Google]
40KB, 778x1156px
>>9117632
>>
File: figure_s1a.gif (57KB, 778x758px) Image search:
[Google]
57KB, 778x758px
>>9117634
>>
File: figure_s2a.gif (59KB, 778x703px) Image search:
[Google]
59KB, 778x703px
>>9117635
>>
File: figure_s3a.gif (40KB, 778x1152px) Image search:
[Google]
40KB, 778x1152px
>>9117637
>>
>>9105943
>2015
>>
>>9105952
So dominicans are stupid and happy.
>>
>>9118084
Dominicans from the Dominican Republic not from Dominica
>>
>being better at math than reading
the fuck
>>
>>9119496
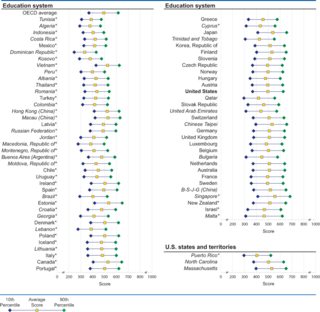
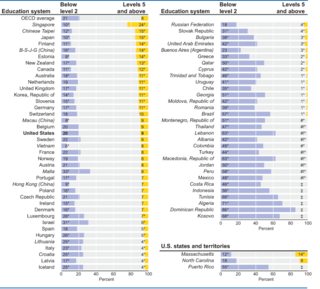
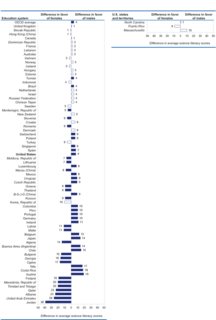
PISA items have a very stron reading component (that's why it's "reading literacy", "mathematical literacy" and "scientific literacy") so very probably the countries that do better in mathematical literacy compared to reading literacy (like pretty much all of the Chinese countries, Switzerland, Korea, Russia, Lebanon, etc.) do acually better in math (pure math) compared to reading
>>
>>9117626
wtf, I LOVE women now!
>>
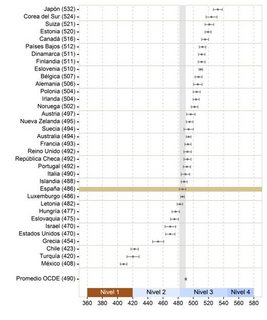
File: Puntos en Lectura.jpg (54KB, 521x624px) Image search:
[Google]
54KB, 521x624px
>>
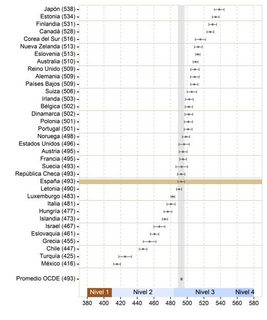
File: Puntos en Matemáticas.jpg (57KB, 521x624px) Image search:
[Google]
57KB, 521x624px
>>9123119
>>
File: Puntos en Ciencias.jpg (55KB, 521x624px) Image search:
[Google]
55KB, 521x624px
>>9123122
>>
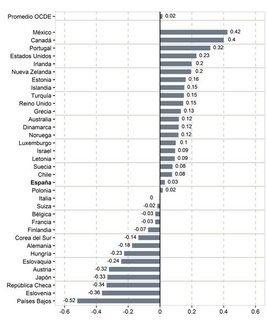
File: Motivación Intrínseca.jpg (45KB, 486x582px) Image search:
[Google]
45KB, 486x582px
>>9123123
>>
>>9110297
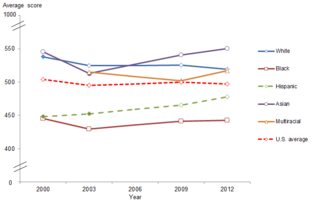
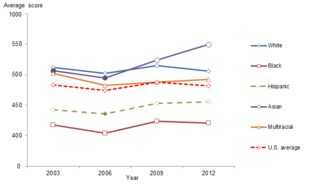
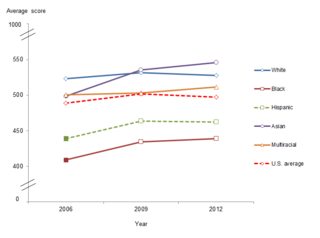
Is this actually true?
>>
>>
>>9123451
https://nces.ed.gov/surveys/pisa/pisa2015/pisa2015highlights_4f.asp
https://nces.ed.gov/surveys/pisa/pisa2015/pisa2015highlights_5e.asp
https://nces.ed.gov/surveys/pisa/pisa2015/pisa2015highlights_3f.asp
https://nces.ed.gov/surveys/pisa/pisa2015/pisa2015highlights_11f.asp
>>
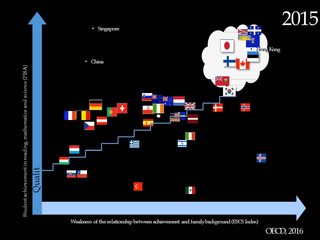
File: pisa-slide.jpg (42KB, 960x720px) Image search:
[Google]
42KB, 960x720px
>>9105943
>>
>>9114172
As a chink, do you have a source for any of the more deranged claims made in the pic? Sounds to me like a faggot who just recited off a book he read, possibly one with an agenda
Tried to google some of em, turned up with nothing.
>>
>>9123451
Not that Anon but on a technical level it is.
However China is listed three times by provinces thus allowing it's average to be skewed selectively. Singapore and Estonia a have a much lower population rate (less than 10 million) which skews the total average once you include all countries.
Also knowing these skewed averages it's bad form (and unfair) to then isolate american demographics individually without then doing the same to other demographics from other countries.
Thread posts: 156
Thread images: 94
Thread images: 94
